HONORS 222: Exploring the Greenland Ice Sheet
Combining Data Visualization with Environmental Investigation.
Taken from Honors Reflections :)
I was initially drawn to the class Polar Places and Spaces: Exploring the Greenland Ice Sheet because I’ve always been interested in learning more about how climate change shows up differently across the world’s ecosystems. When I saw that the class was about Greenland, I immediately wanted to sign up because it felt like a particularly impactful place to study - in middle school, I learned that Greenland has one of the largest reserves of ice on Earth. I was also curious about how environmental change intersects with human experience, especially the ways Indigenous communities in the Arctic might be navigating climate change. Overall, this class seemed like an opportunity to deepen my base understanding of how climate change impacts the environment and inhabitants of the Arctic.
Another element that intrigued me was that at the time, Greenland was (and still is) often appearing in political discourse. Hearing rhetoric about the U.S. “acquiring” Greenland made me realize how little most people (including myself) actually understand about the island’s history, communities, and sovereignty. I wanted to approach these questions from an academic standpoint rather than a perspective I was just seeing through the news, and this course seemed like a great way to do that.
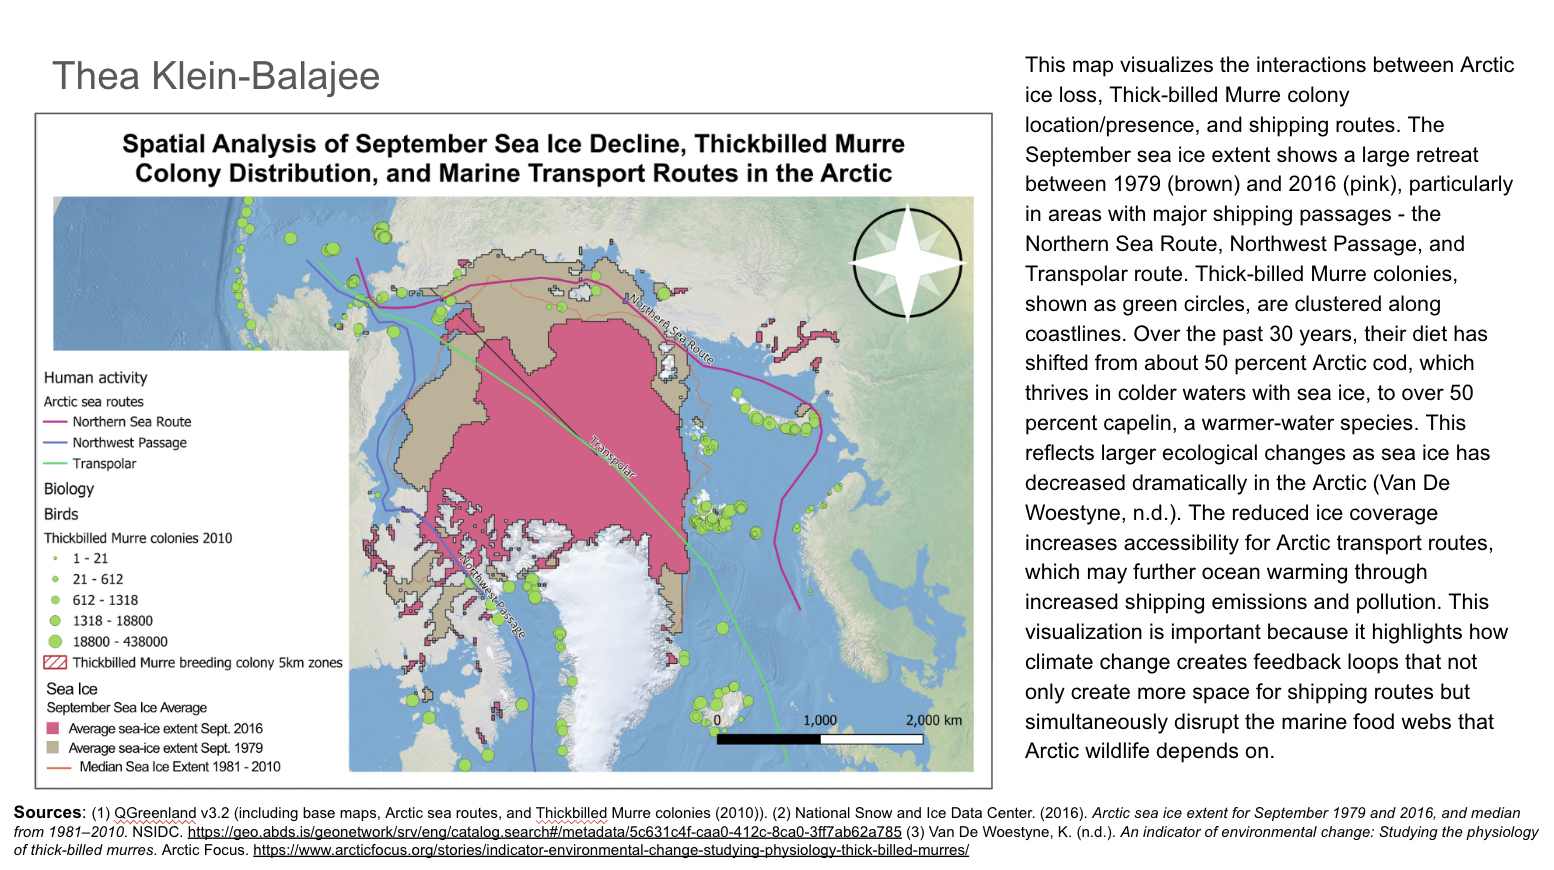
As for what I could apply my learning from this class to, working with QGreenland and QGIS was challenging, but it opened up an entirely new way of thinking about spatial data, visualization, and climate analysis. Being able to map multiple data groups, such as the distribution of thick-billed murre populations alongside patterns of surface ice retreat and increased ship traffic (my final project for the quarter), was incredibly interesting. It helped me see how ecological, environmental, and human systems can be layered and interpreted together, and how relationships can be discovered through data visualization. It was the first time I felt like I could see climate change not just conceptually, but visually. Because of this discovered interest, the tools and questions from this class have already started giving me inspiration for what I want to explore outside of coursework. I’m particularly excited about using data visualization to study environmental change closer to home, especially in the Pacific Northwest. I’ve been thinking about how similar spatial methods could be used to look at forest health, rainforest expansion or loss, and long-term land-use patterns in this region. This class made me realize that GIS is an opportunity for future exploration!
Moving forward, I can imagine taking on side projects that involve open-source environmental datasets or even integrating GIS into creative or design-focused work. I am interested in game design, so perhaps I could use data visualization through this sort of platform to design a game around climate change awareness.